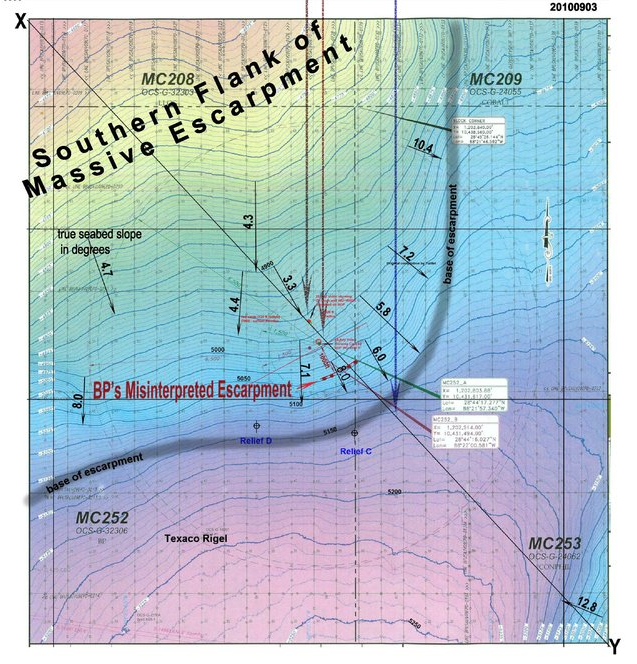
Forensic Analysis of BP’s Bathymetric Chart


Forensic Analysis of BP’s Bathymetric Chart
by BK Lim, Geohazards Specialist
(2 Sept 2010, hydrocomgeo@gmail.com).
For a disaster of this magnitude, many things must have gone wrong from the very beginning. The long chain of human errors leading to the disaster could not have been purely accidental or random in nature. There must have been willful negligence, ignorance or misinterpretation to capitalize on certain opportunities or to make good on some bad situations along the way.
Like many, I followed the intense discussions at The Oildrum.com (TOD) to get some fair technical coverage of the BP’s oil spill disaster. As the disaster wore on, I started to wonder why industry experts like Art Berman, Rockman and many supporting actors (Rocdoc, PinkFud, Quaking, CraigWcoop & others) were so defensive of BP’s lies and zealously stamping out any independent bloggers’ views. If they had been truly professional and interested in seeking and disseminating the truth of the disaster, why were they not discussing incriminating issues that BP seems to be avoiding? Granted that nuking the gushing well was not really a good idea, but why should they be bitterly thrashing Matt Simmons’ apparently valid assertions as well.
Being a geohazards specialist, I started my own investigation with the bathymetry as I had always done. Being the lowest denominator (in terms of data ranking of importance and sophistication) any evidence of willful negligence should be readily apparent. To my surprise, I found many issues with the bathymetry which nobody seems to be discussing at all. So in the first draft of my posting; Would a better bathymetry chart have made the difference?, I asked the question “Is there something wrong with BP’s Macondo bathymetry?”
There had been some initial troublesome scaling errors while trying to superimpose BP’s bathymetry onto the satellite image from google. I could not find the reference points and was unfamiliar with a prospect using US imperial system. Instead of correcting it (since it was inconsequential to the development of the geological model) the scaling error was left uncorrected in the initial posting. It looked like an opportunity to use it as a “control” to gauge the readers’ responses on the erroneous Macondo bathymetry.
The five areas of fundamental problems with BP’s Macondo bathymetry are:
1. Data acquisition fraud. BP’s Macondo “smoothened” bathymetry did not appear to be consistent with MBES (multibeam echo sounder) images scanned at close range to the seabed. The bathymetry appeared more likely to have been compiled from widely spaced SBES (single beam echo sounder) data along surveyed lines. MBES mounted on AUV is designed to optimally scan the seabed with multiple ultrasonic beams (>100 to 250 beams) from an altitude of 150-200 ft above the seabed, while the conventional SBES utilizes a single ultrasonic beam from the sea level (5000 ft above). Needless to say, data acquired using the AUV-mounted MBES would yield a much higher resolution image of the seafloor as compared to one using a SBES. Three seafloor images using comparable 3m-bin size MBES data were included in my earlier posting (Would a better bathymetry chart have made the difference?) for comparison.
From my experience, passing the backup SBES data as MBES (a form of cheating) is widespread in the industry. Imagine a multimillion AUV-MBES system failing to function in the middle of a survey out in the open sea. Would the survey contractor stop work, return to port and resume survey after the system had been repaired? Sometimes it is not the question of cost. Whether time would permit is another important issue. In most cases, the survey contractor would rather continue the survey using the backup SBES system than to lose a few million dollars. With survey acquisition costing between 50,000-75,000USD/day, the compelling choice is clear. Whether the BP company man onboard the vessel knew or was happily sleeping in his cabin, is open to question. Of course, 90% of the survey contractors would never openly declare that their AUV mounted MBES was non-operational 4850ft below the sea surface. Their favorite fallback argument has always been “What is the fuss as long as the bathymetric chart can be produced?” When the bottom line is at stake, quality and resolution fly out the window. MBES can cost more than 10 times the cost of SBES data acquisition.
2. Data compilation fraud: At the post survey data compilation stage, few survey companies would openly admit their data acquisition shortcomings. So although the bathymetry for the Macondo prospect was compiled mainly from SBES data, the legend in the chart still states “Multibeam Processing Sequence”. The graduated colour scheme normally used in MBES images (unusual for SBES compilation), is another tell-tale sign of willful intent. There are other evidences but these should suffice for the purpose of this article.
SEE REGULAR SIZED SCREENSHOTS AND MORE AT THE FOLLOWING LINK:
http://phoenixrisingfromthegulf.wordpress.com/2010/09/04/forensic-analysis-of-bp%E2%80%99s-bathymetric-chart/
No comments:
Post a Comment